Why AI demands better data
AI makes craftsmanship in data more important, not less. When a credit analyst asks an AI agent about a property, the quality of the answer is entirely determined by the quality of the underlying data. Shallow data produces shallow answers. Carefully sourced, deeply linked data produces intelligence you can actually act on.
A recorded deed of trust isn't just a loan amount and a borrower name — it contains party roles, legal descriptions, cross-references, riders, and subordination clauses. An SEC 10-K isn't just a balance sheet — it contains fund structures, risk factor disclosures, and management discussion that reveals a lender's actual credit posture. The craftsmanship is in extracting all of this nuance — and connecting it to the right property, borrower, and lender.
CRE credit data comes from thousands of sources — every one of America's 3,100+ county recorder offices, each with their own format. 4,471 bank call reports. Thousands of SEC filings, court dockets, and servicer reports. We use AI to ingest, match, and quality-control this data at a scale that would be impossible manually — but the design of how it all fits together is deeply intentional.
We do the deeper, richer linking work — the entity resolution, the source reconciliation, the property-level stitching across hundreds of datasets — so that when our clients ask a question, the AI has the full picture. The actual loan, the actual lender, the actual borrower, linked to the actual property, verified against the actual county record. Better data in, better answers out.
The standard the industry deserves
$5B+ is spent annually on CRE data. The industry has strong platforms with deep expertise in their respective domains. But the people who rely on this data — the analysts, the underwriters, the portfolio managers — still spend hours reconciling across systems. An analyst logs into one platform for loan information, a second for servicer reports, a third for borrower data, and then goes to the county recorder directly to verify what was actually filed. The sources frequently disagree.
This isn't a failure of any single platform. It's a structural challenge: real estate credit touches thousands of data sources, each with its own schema, its own cadence, and its own edge cases. There are over a thousand nuances in how CRE data is recorded, matched, and connected — from county formatting quirks to entity name variations to lender assignment chains that span years.
We believe this complexity deserves the same craftsmanship that great software companies bring to their hardest problems. Not brute force. Not shortcuts. Thoughtful design, applied systematically, iterated continuously.

Matching every mortgage to the land beneath it
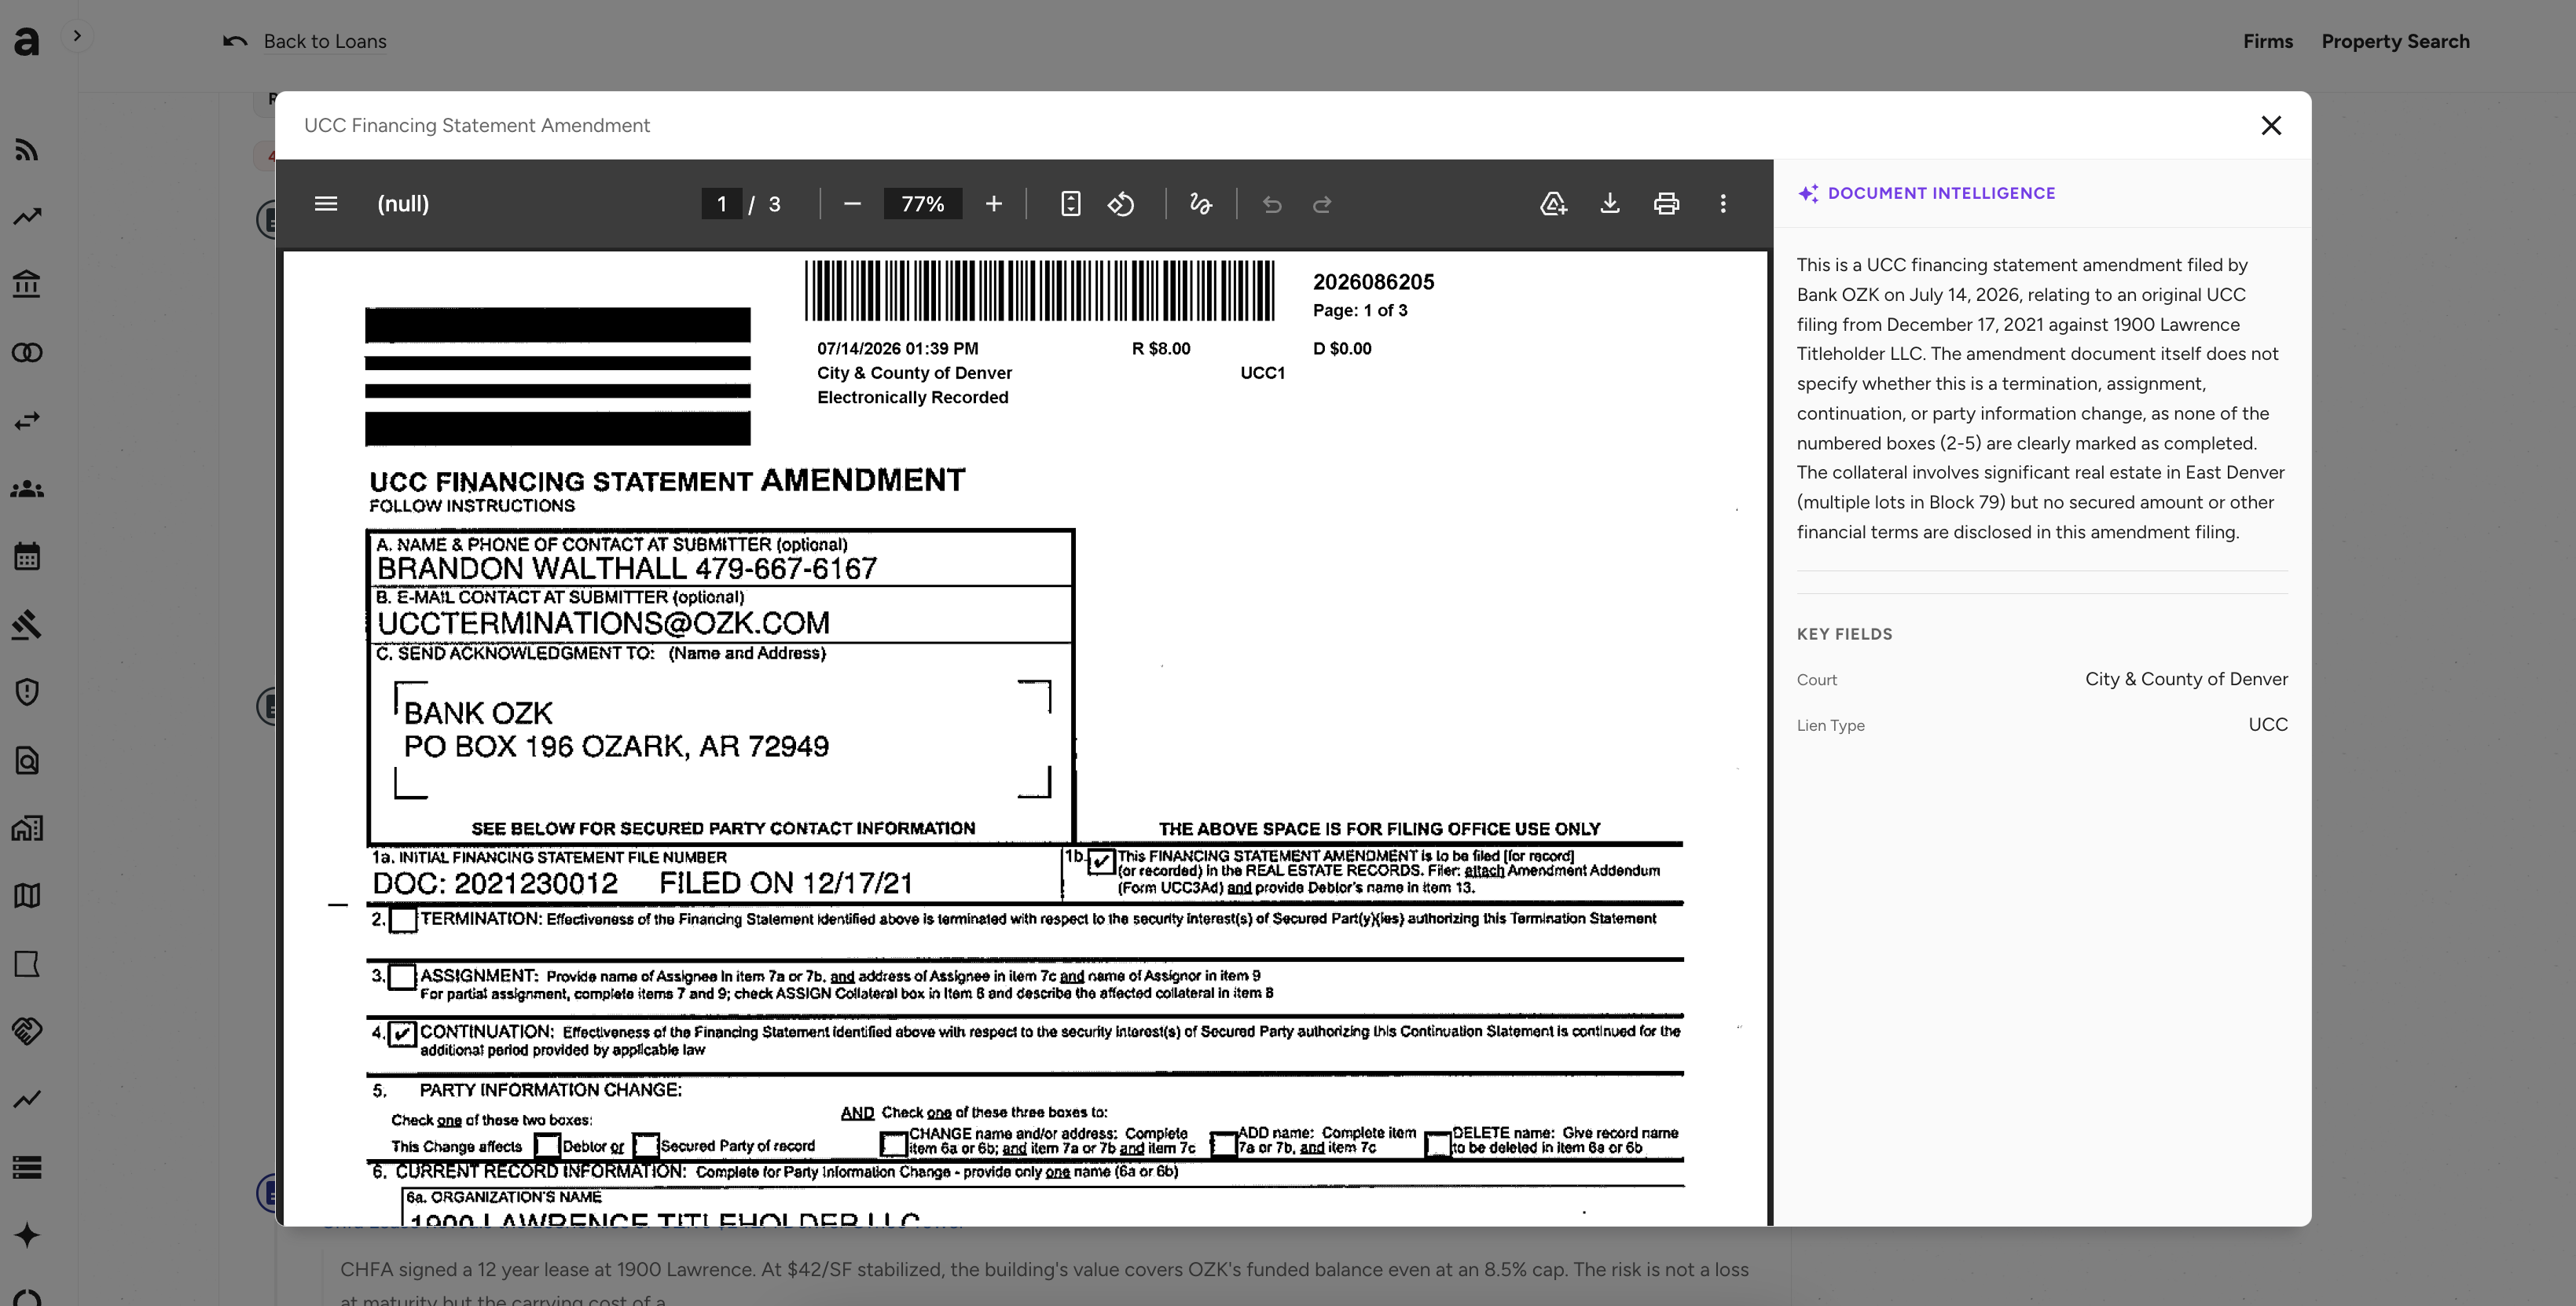
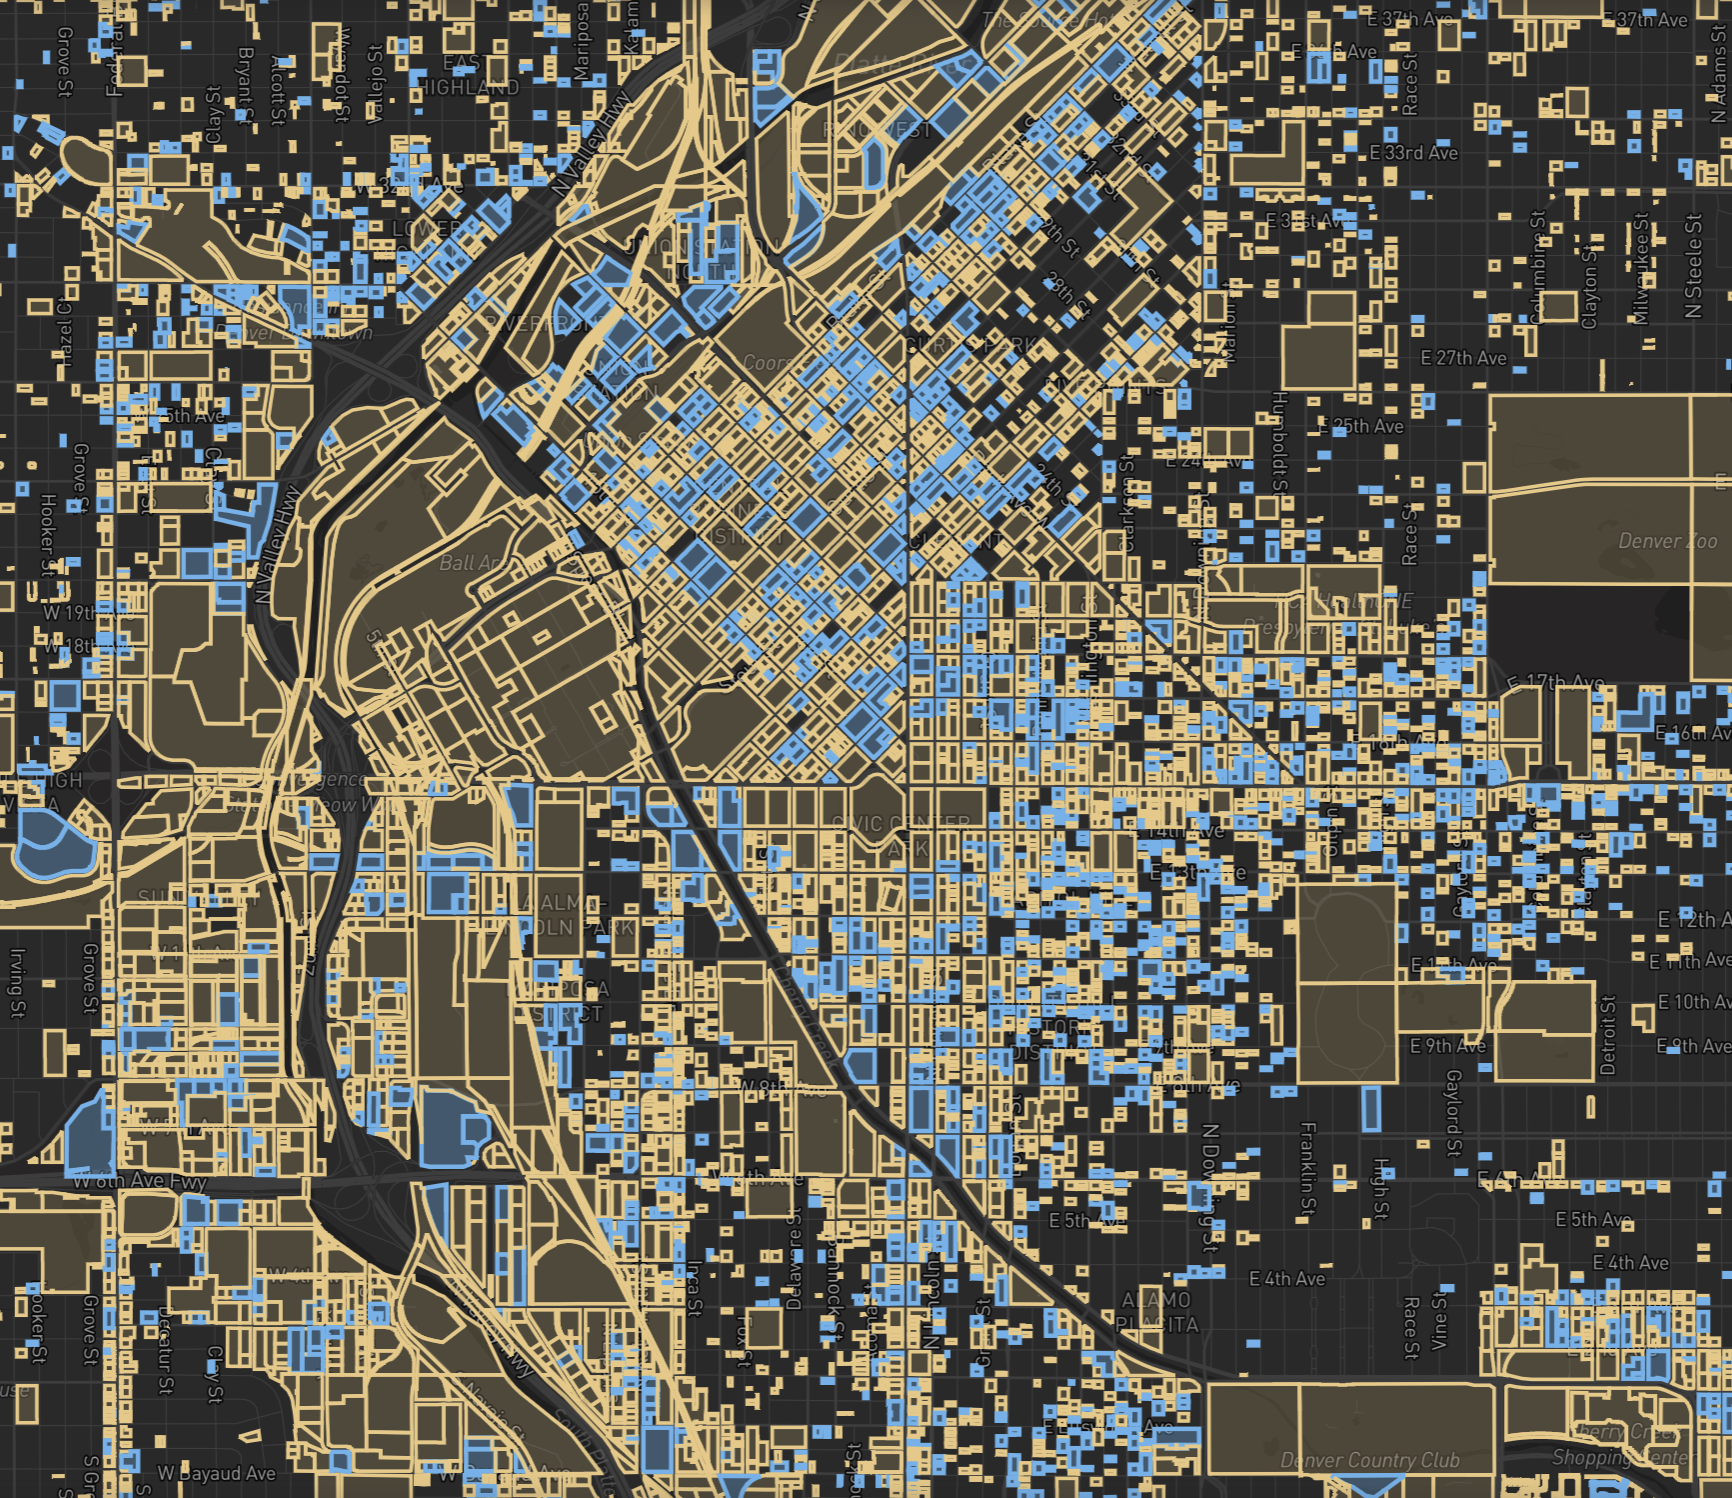
Here's an example of what craftsmanship looks like in practice. There are hundreds of thousands of mortgage filings in county records that don't cleanly link to the right property. Some are filed in the wrong county. Others have transposed addresses, misspelled borrower names, or refer to a legal description that doesn't match the parcel. Still others are filed against a holding company three layers removed from the actual property owner.
The easy approach is to ignore them — if the automated matching engine can't figure it out, the filing gets dropped. But those hard-to-match filings are often the most important ones: the largest commercial mortgages, filed through SPEs, with syndicated structures, involving multiple parcels.
We built entity resolution systems that trace SPE ownership chains through state corporate registries, SEC filings, and investment adviser records. We built spatial matching that links filings to parcels even when the address is wrong but the legal description is right. We built AI agents that resolve the cases the automated systems can't handle — and they get smarter with every resolution. This is the work that makes the data trustworthy.

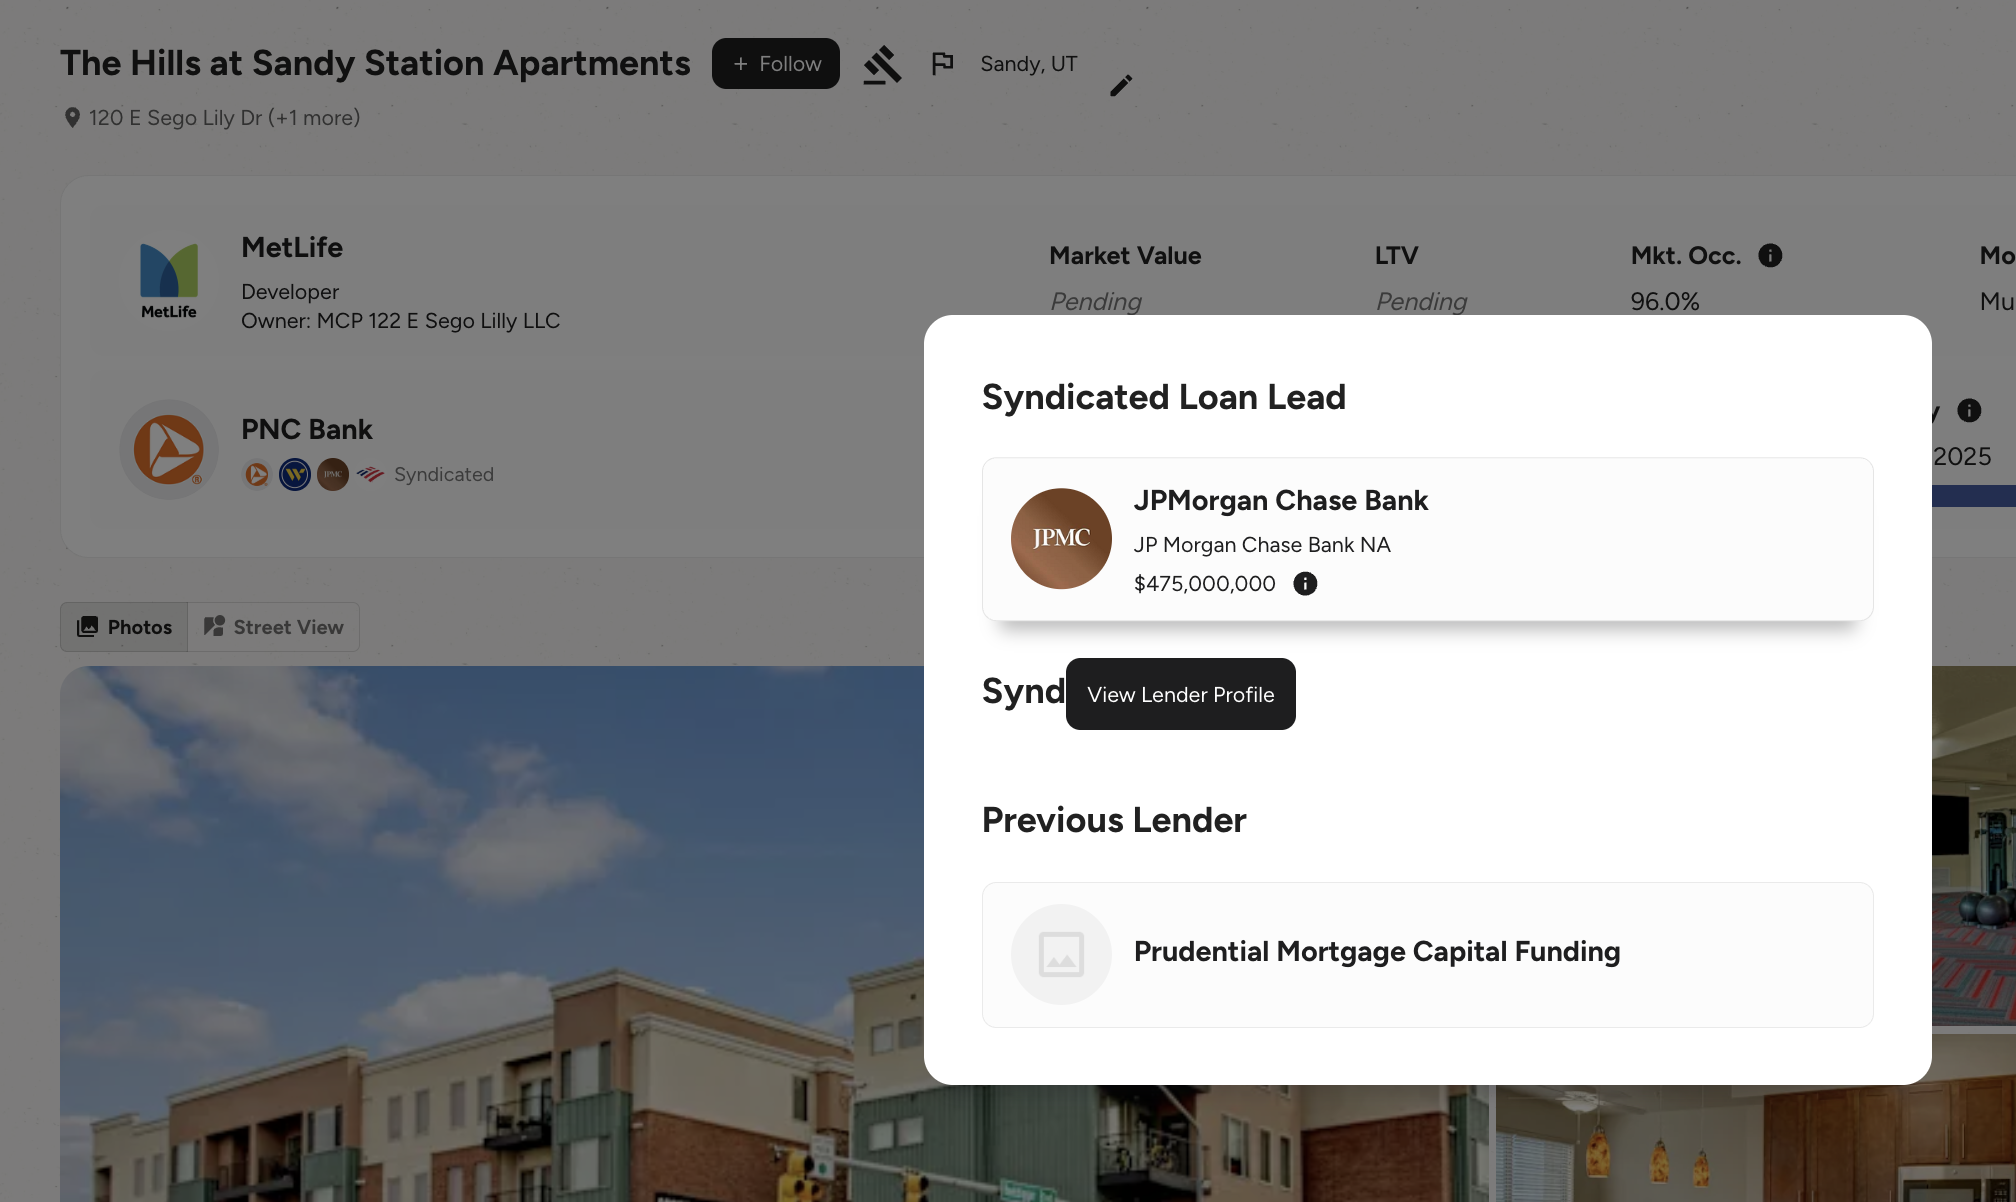
Untangling syndicated structures
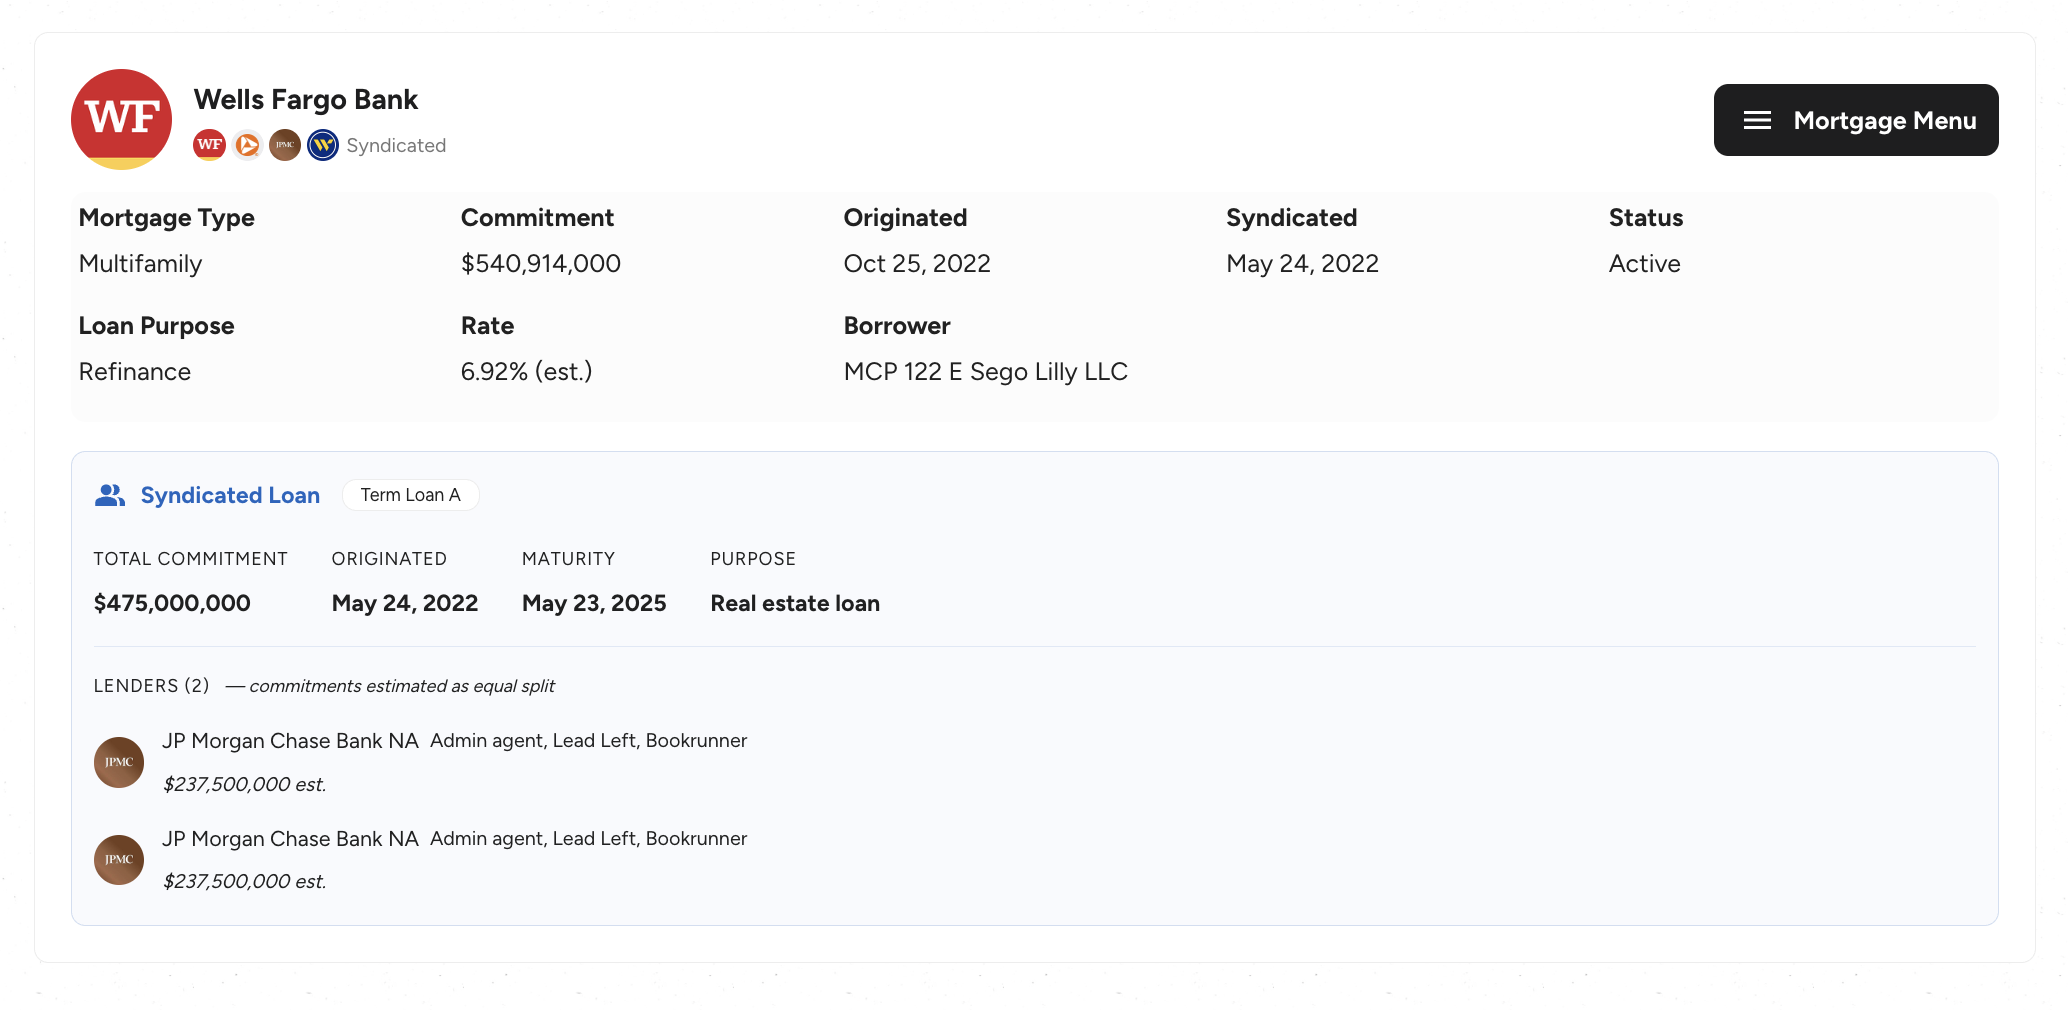
When a $500M commercial loan is syndicated across six banks, the data challenge is substantial: standard sources often show six separate $500M loans. The lead arranger gets credited with the full amount while participants are invisible.
We integrate LSEG Loan Connector data with county records and HMDA filings to identify syndicated facilities, resolve participants, and attribute the correct pro-rata share to each lender. When Bank of America shows up as the agent on a $300M facility with four participants, we don't credit them with $300M — we show the actual allocation.
Making private credit visible
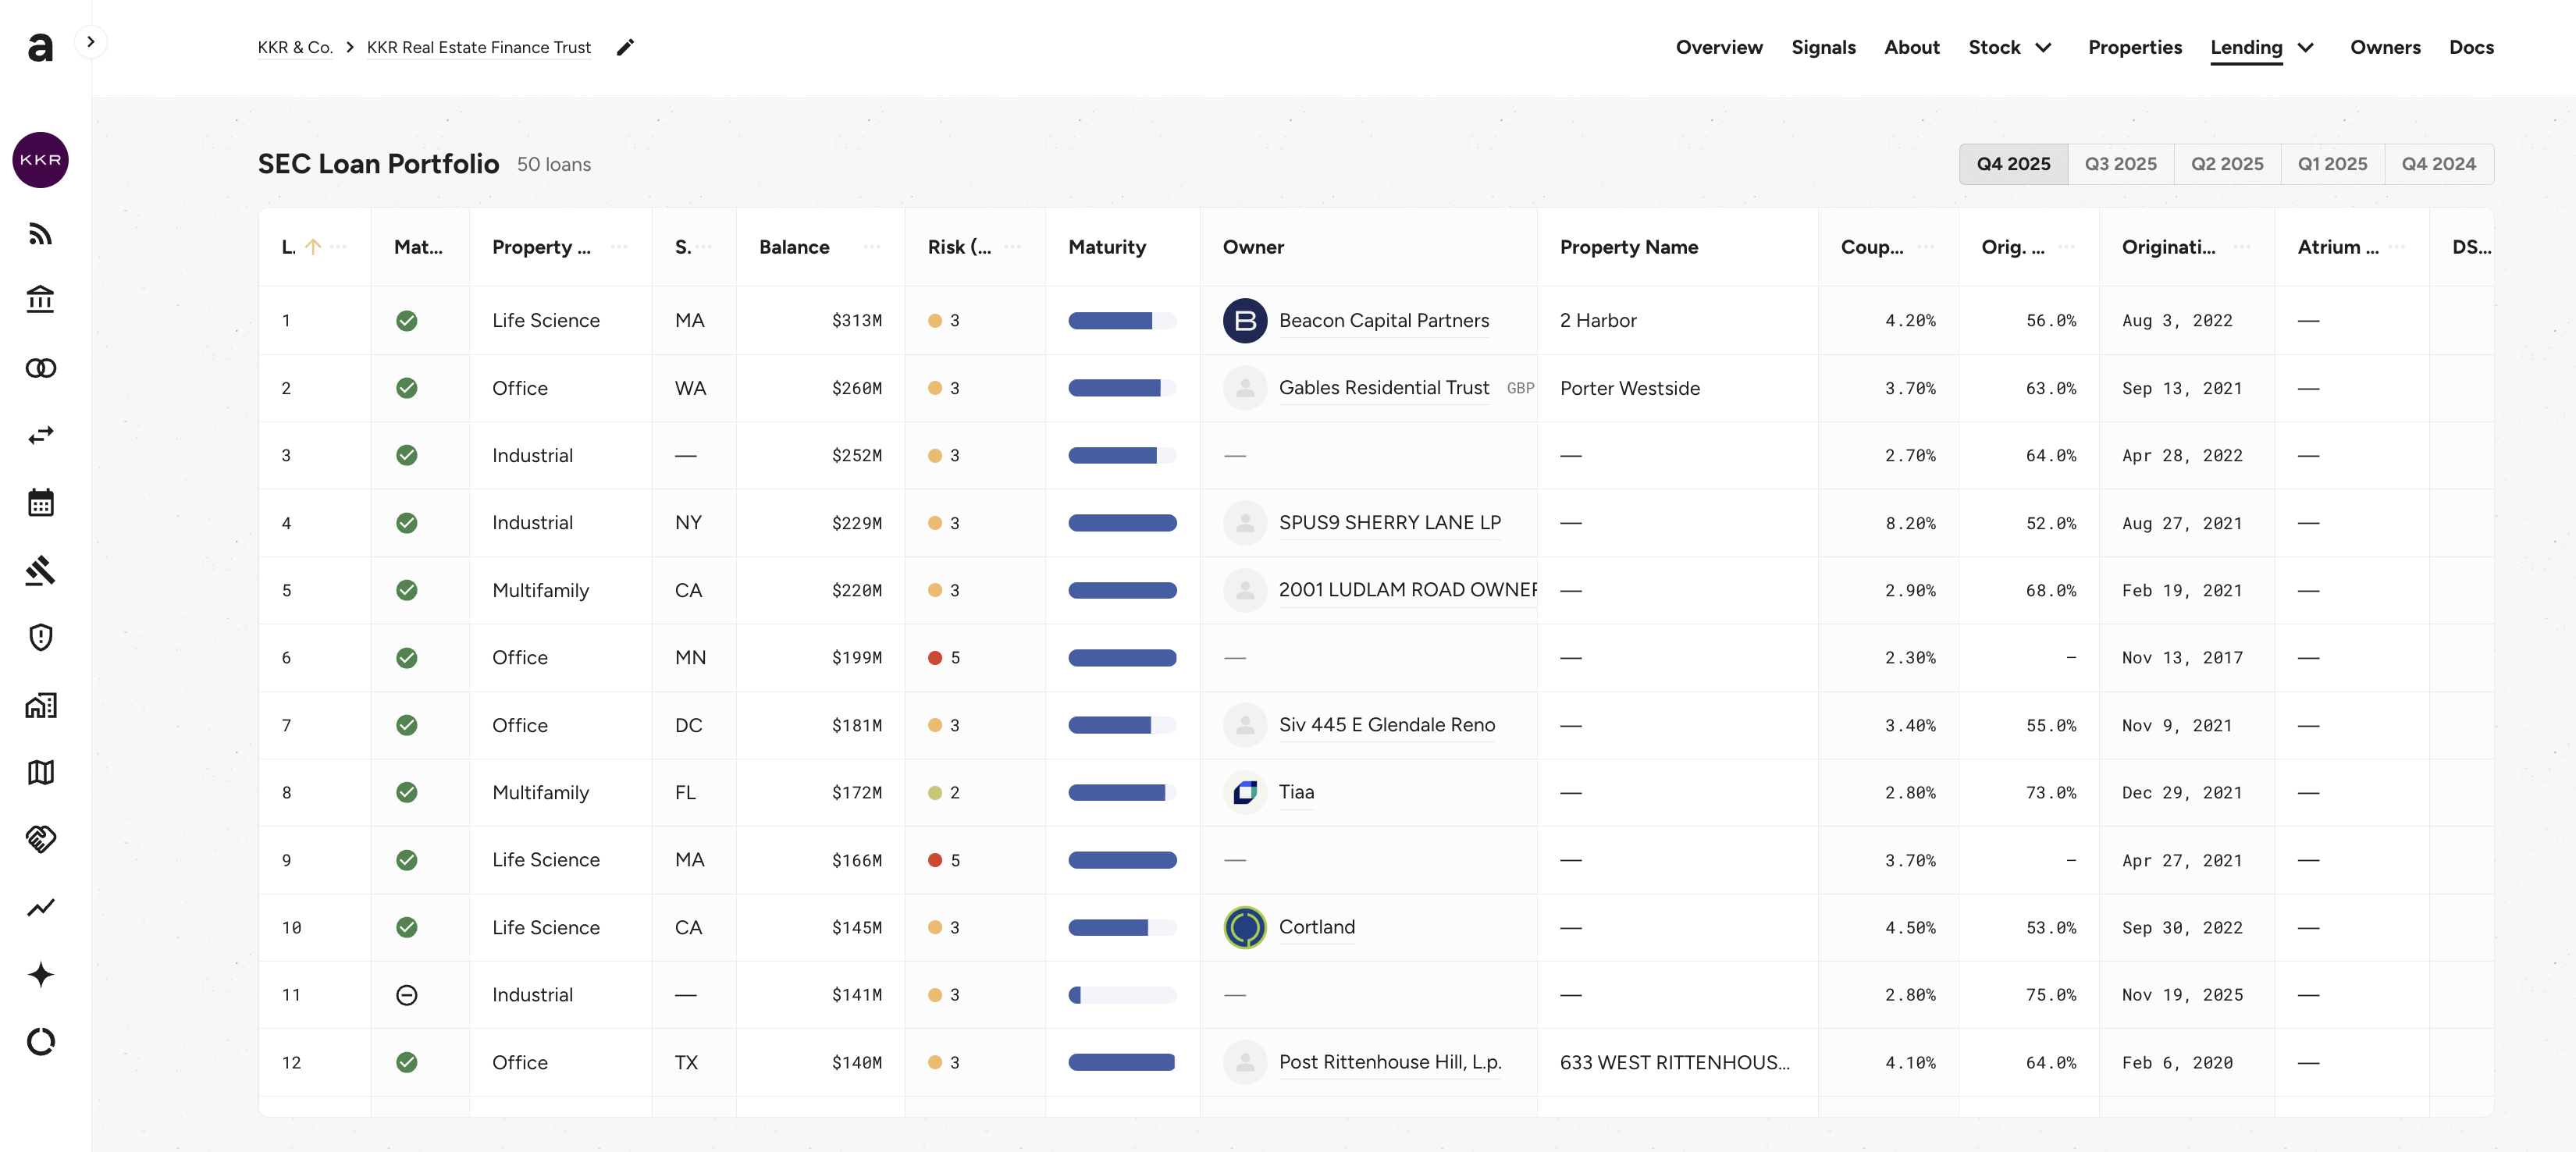
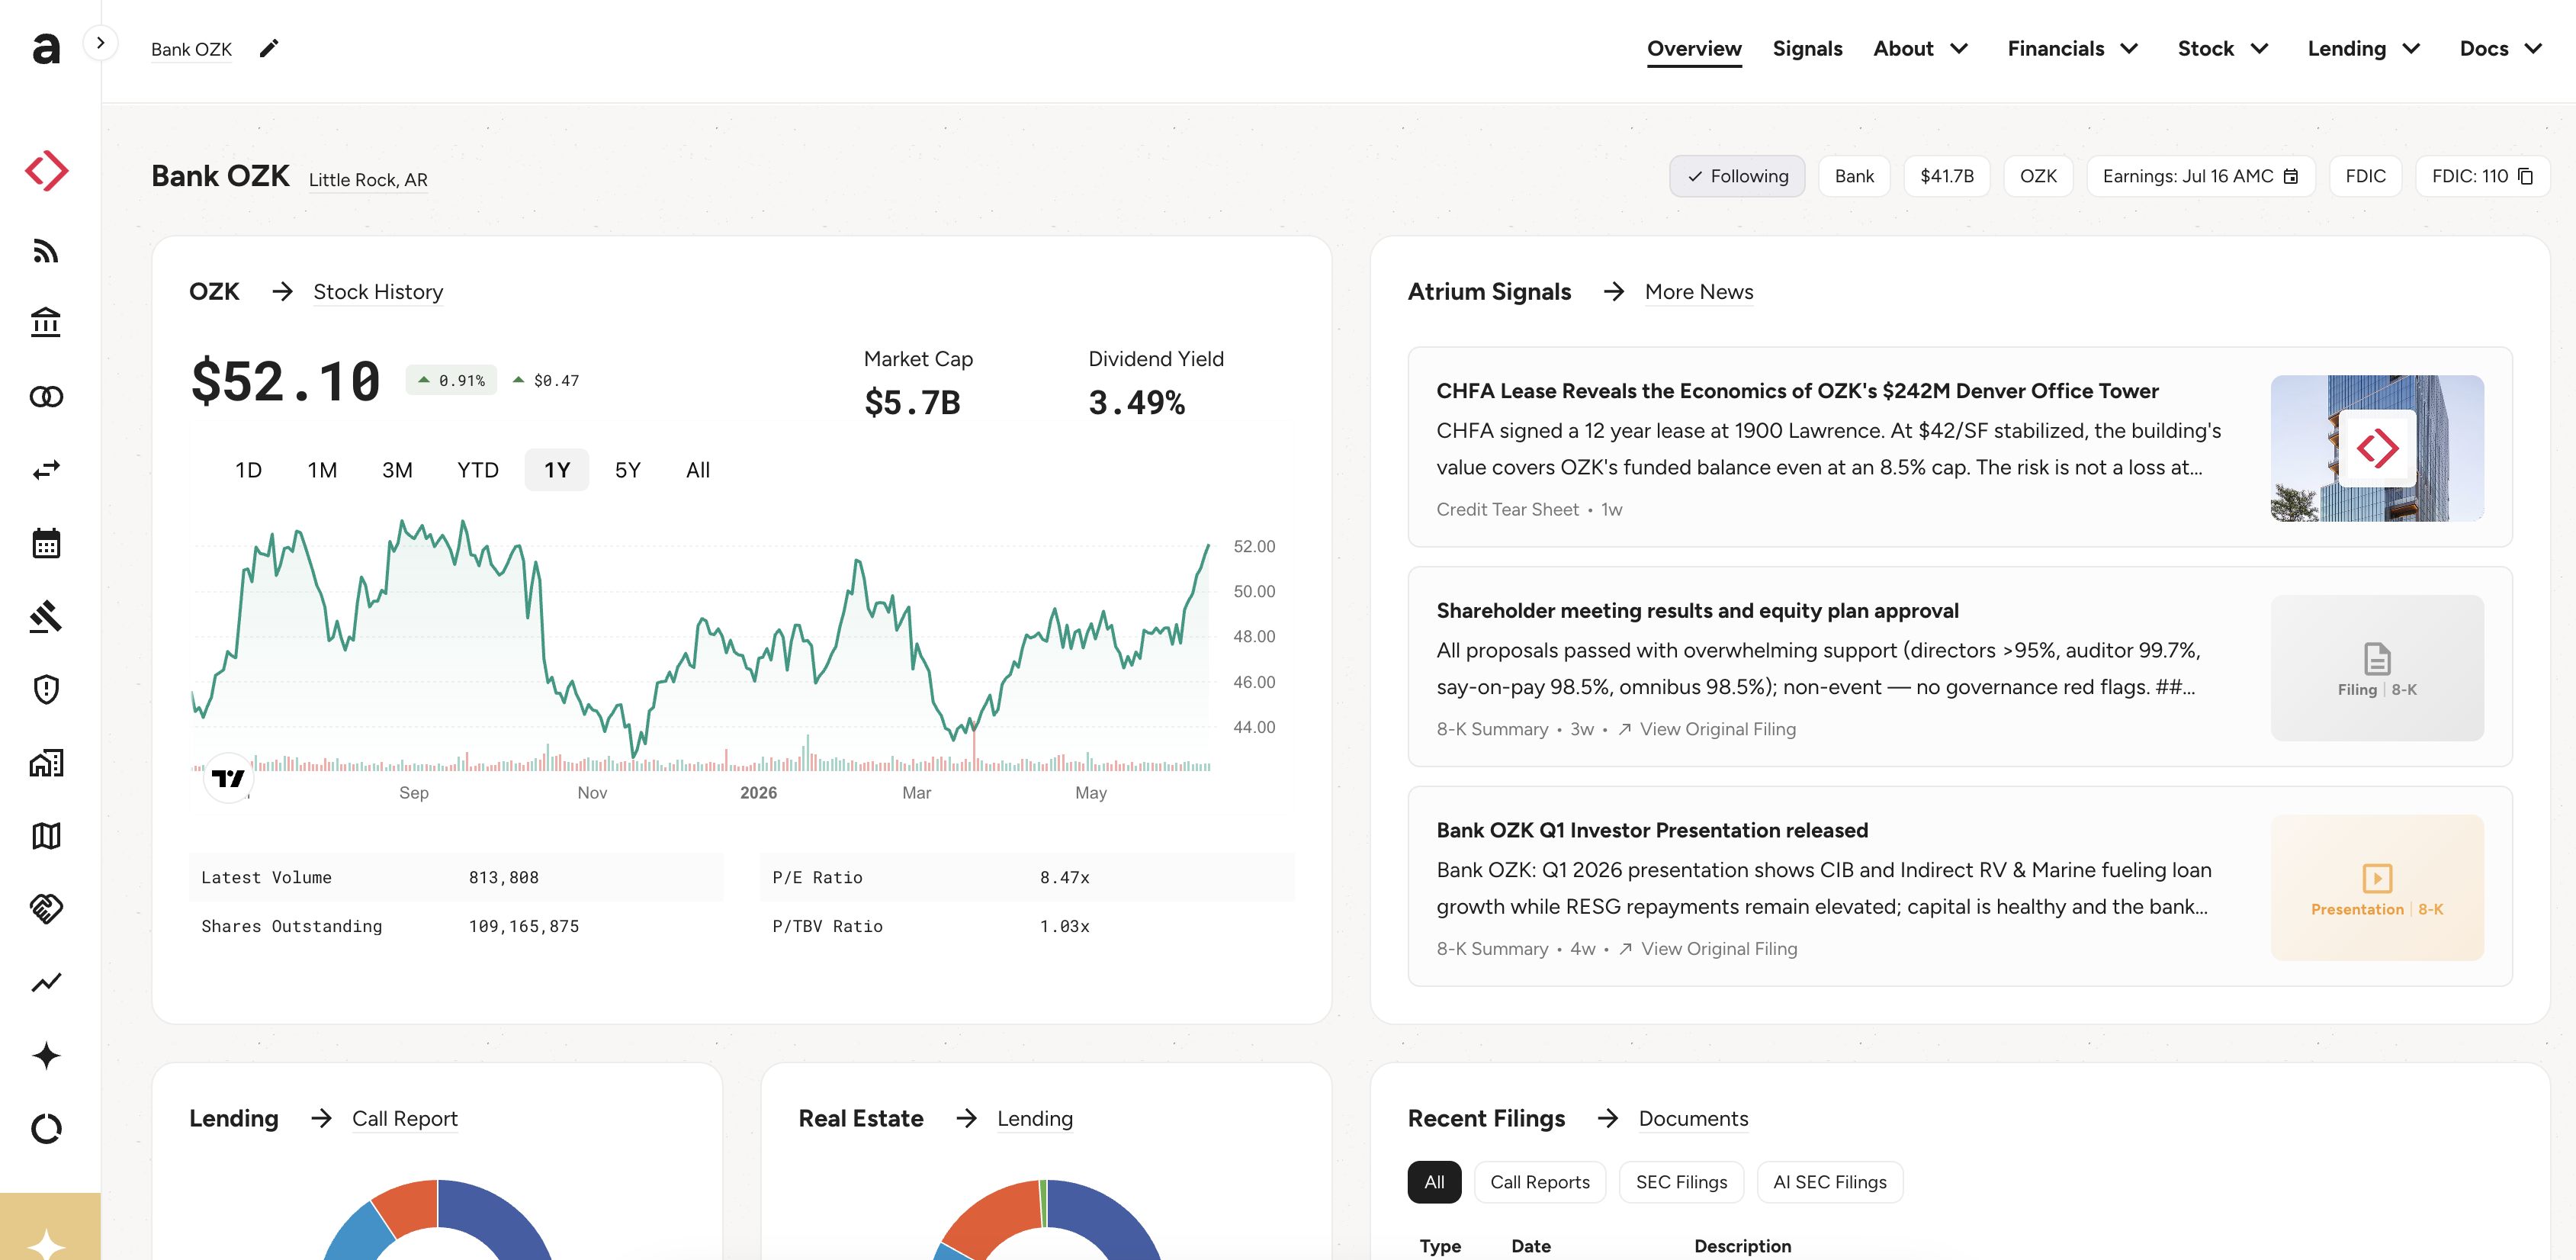
The growth of private credit created one of the most interesting data challenges in CRE. When Bridge Investment Group makes a $66M multifamily loan through "BMF IV Az LLC," most platforms see an unknown LLC. We see Bridge Multifamily Fund IV, a $1.6B vehicle managed by Bridge Investment Group (ticker: BRDG), with institutional LP investors, an SEC-registered adviser, and a specific credit box.
We've resolved thousands of these SPE-to-fund-to-GP chains. We track individual fund performance, investor composition from 990 and 13F filings, back-leverage facilities, and credit box parameters. The result: private credit is no longer a black box. You can see exactly which fund, which vintage, which strategy is behind every loan.
Speed as a design principle
CRE credit intelligence has historically moved on a quarterly cadence. Call reports come out 90 days after quarter-end. CMBS servicer reports update monthly at best. County record aggregators often lag weeks behind what the counties themselves have published.
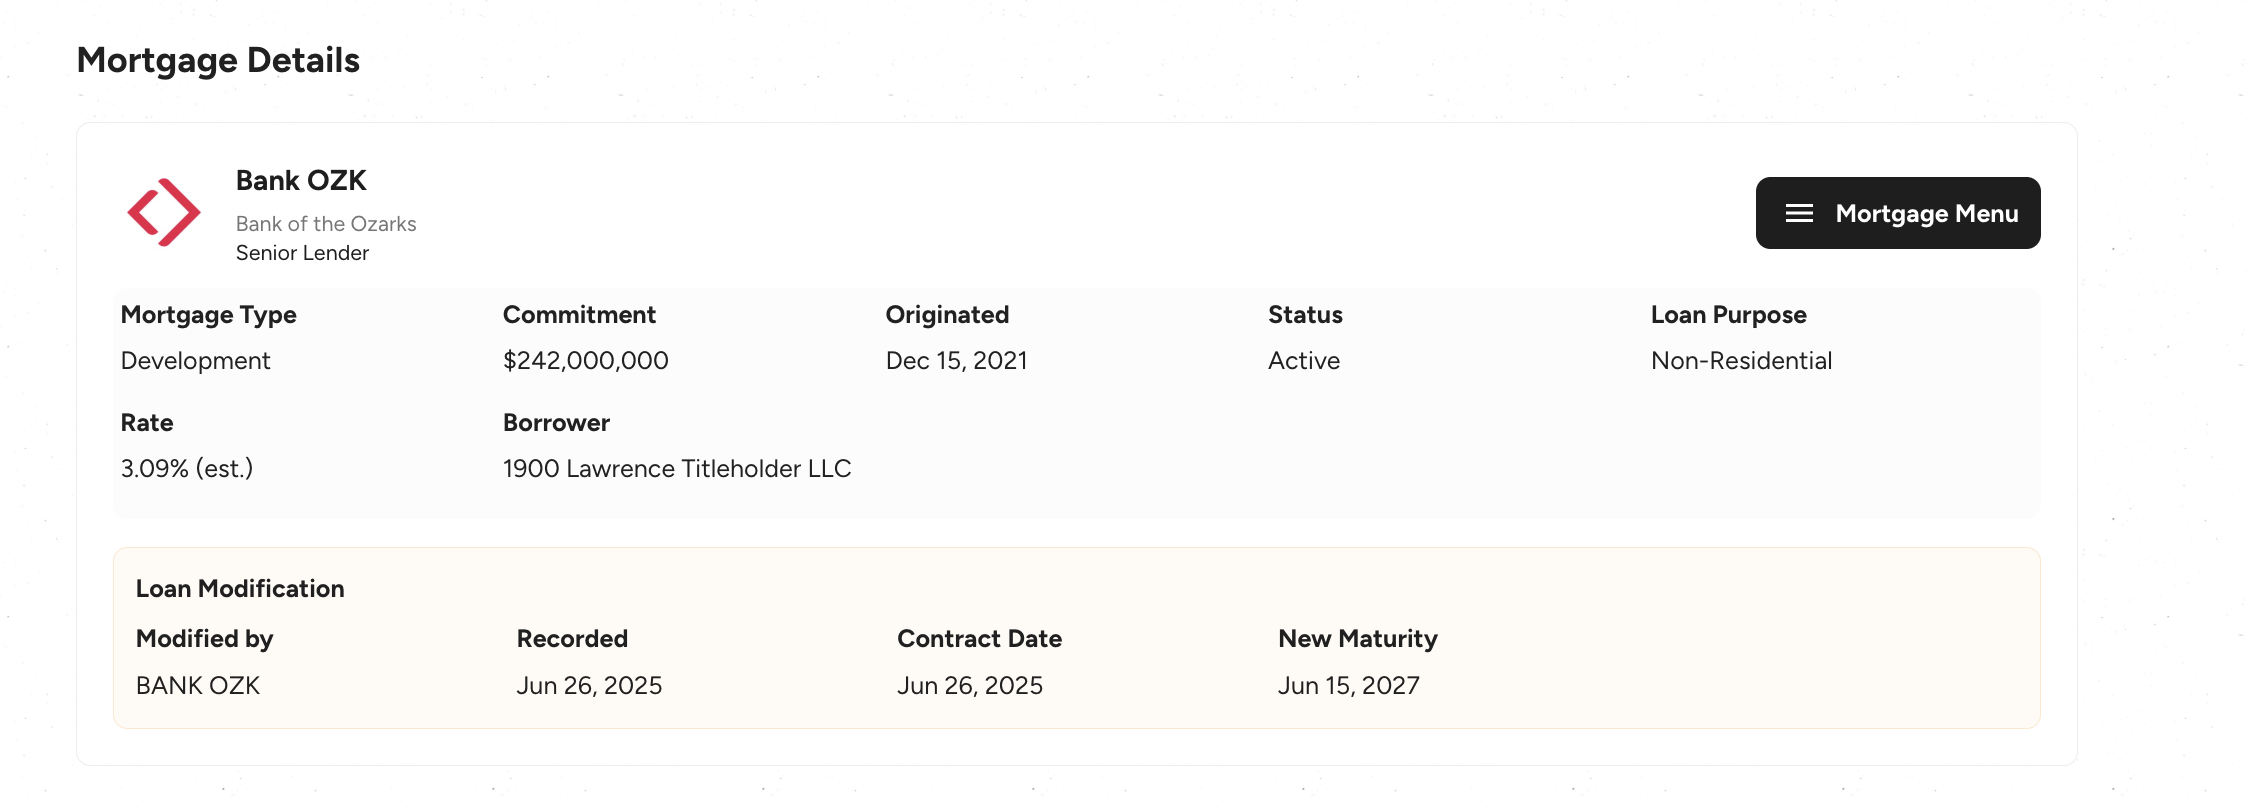
We believe capital markets data should move at the speed of capital markets. We've built direct pipelines to the largest county recorder offices — New York City (ACRIS), Los Angeles, Chicago, Phoenix, Miami-Dade, and dozens more — pulling in new filings and documents as fast as the counties publish them. In NYC, we're typically within 10 minutes of the clerk's office.
For securitized loans, the breakthrough is linking pool-level data back to county records. When a Fannie DUS loan prepays, we often know from the county recording before it appears in the monthly investor file — because we see the satisfaction of mortgage or the new origination that replaces it.

Reconciling the capital stack
A bank's call report says it has $4.2B in CRE loans. Our county-record-based attribution says $3.8B. Which is right? Both — and neither. The call report includes participations purchased, construction draws not yet recorded, and loans in subsidiaries. The county records miss loans filed in wrong jurisdictions and include loans that have been sold but not yet assigned.
We reconcile these differences systematically. For every FDIC-insured institution, we build a coverage ratio that tracks how much of their reported CRE book we can attribute to specific properties. When the ratio is low, we investigate — and the investigation almost always reveals interesting things: hidden portfolios, acquisition pipelines, or data quality issues that no one else is catching.
Hundreds of sources, one coherent picture
HMDA tells us the interest rate, but not the maturity. County records tell us the loan amount, but not the rate. CMBS servicer reports tell us the DSCR, but only for securitized loans. NAIC Schedule B filings tell us what insurance companies hold. HUD tells us which properties have FHA insurance. LIHTC tells us which have affordable housing restrictions. SEC filings tell us which funds own what. Each source is valuable. None is complete.
The craft is in stitching them together at the property level so that a single asset shows its full credit picture: the county filing, the HMDA origination, the CMBS trust it was securitized into, the insurance company that holds the B-piece, the borrower's other properties, the broker who listed it, and the court filing that shows a mechanics lien from the contractor.
We integrate hundreds of datasets. Every one of them has its own schema, its own update cadence, its own quirks. Making them all tell the same coherent story about the same property is the hardest data engineering problem in CRE — and it's the one we wake up every morning to work on.

What the platform becomes
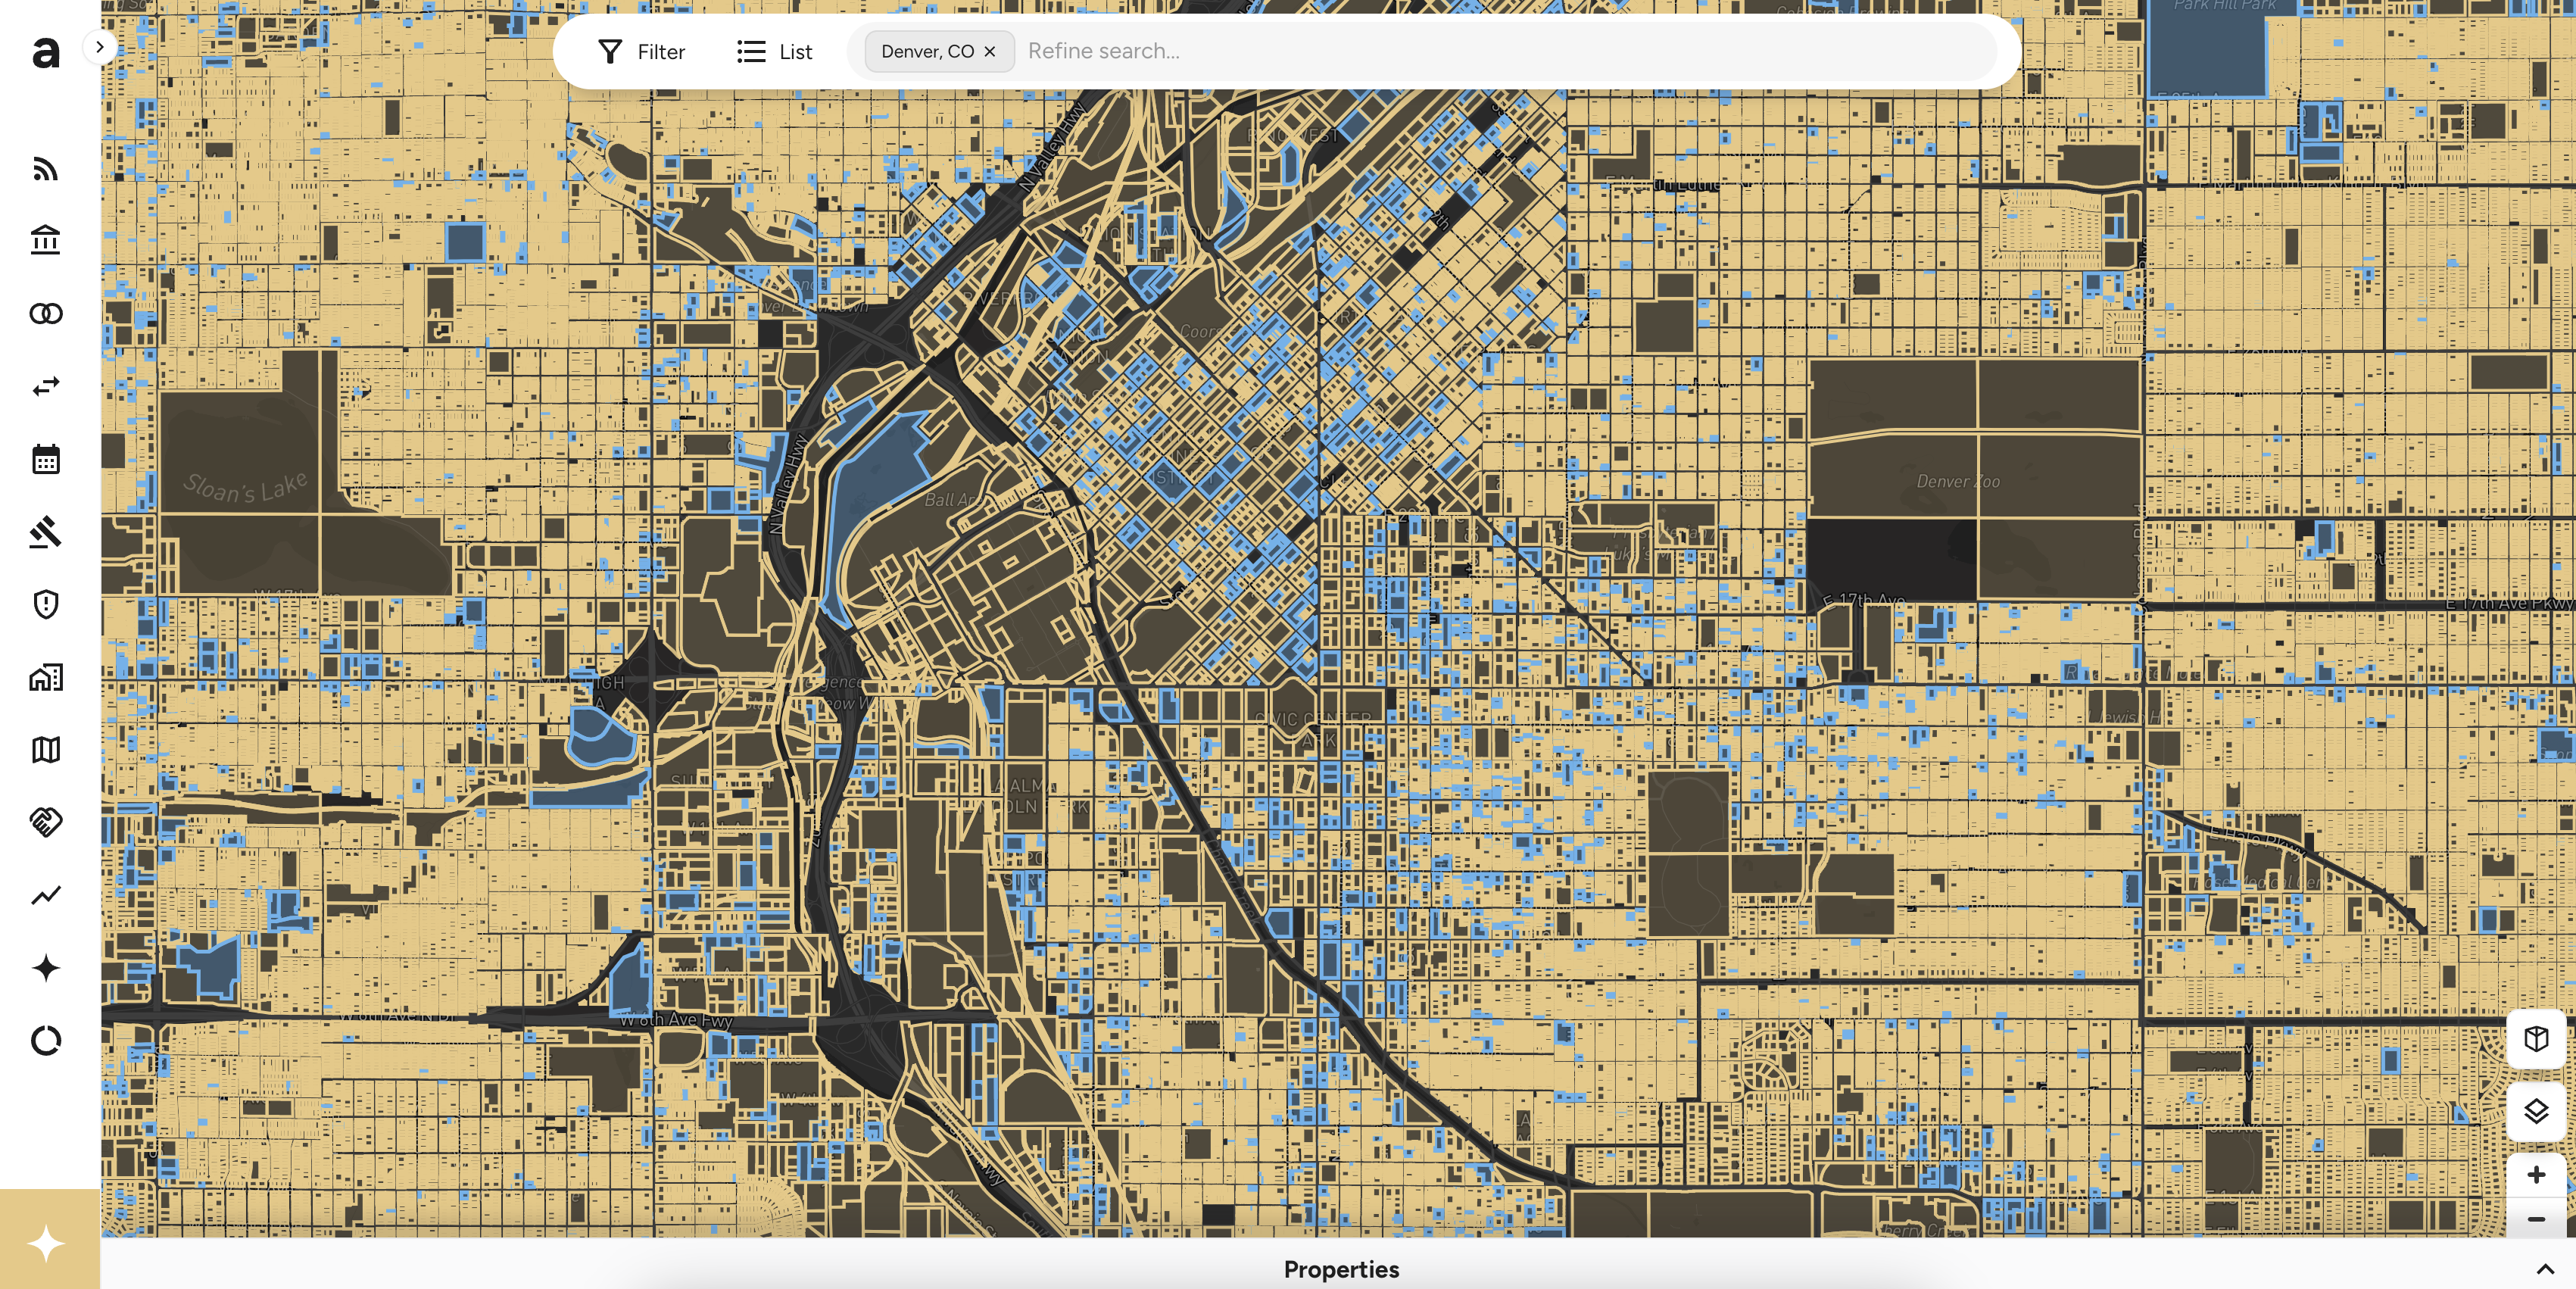
When you apply this level of care — to the mortgage matching, the syndicated allocations, the SPE chains, the reconciliation, the speed, the source integration — something remarkable happens. You stop having a data platform. You start having a credit intelligence layer.
A layer where an equity analyst can see inside a bank's CRE book before the earnings call. Where an agency bond trader can spot a prepay from the county recording before it hits the Fannie tape. Where a broker can see every maturing loan in their market and prospect the borrower before anyone else. Where a capital markets desk can source deals from the data instead of from the grapevine.
This is what we're building. Not another CRE data vendor. The definitive credit intelligence platform — the place where the $10 trillion capital stack is finally visible, accurate, and real-time.
What we believe
We believe CRE credit data should be as trustworthy as the decisions it informs. We believe the hardest problems — entity resolution, source reconciliation, real-time ingestion — are the ones most worth solving. We believe that real estate data should move at the speed of capital markets. And we believe that craftsmanship compounds: every nuance we get right makes the next thousand answers more reliable. When you do the hard work of getting the data right, the intelligence takes care of itself.